Reversing Linux Applications
Static Analysis
Let's start with reversing basic Linux executable files.
Build the executable with the C Program
Install GCC compiler sudo apt install gcc

Build the first program in c, which results in an executable. In this example, we have one simple hello program which results in output to print hello world.
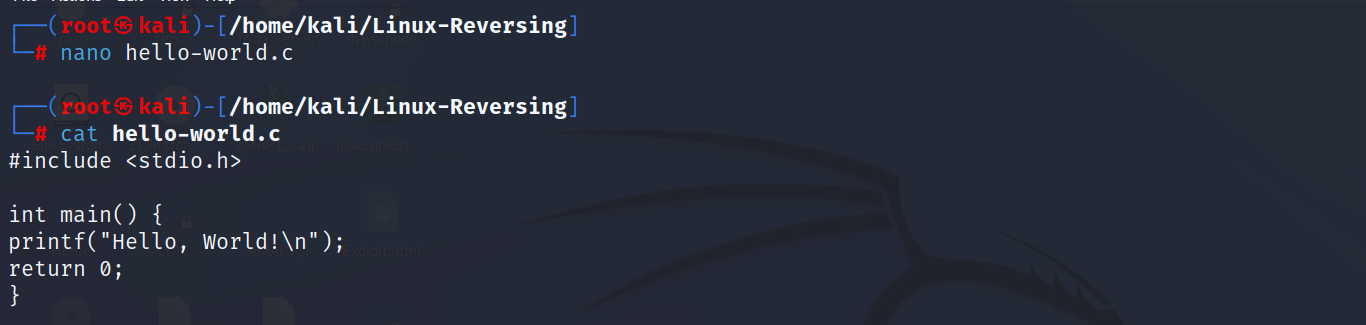
Once the program is written, we need to compile it with GCC., as shown below. You can see that it will result in the executable file. We can use the `file` command in Linux to check the file type.
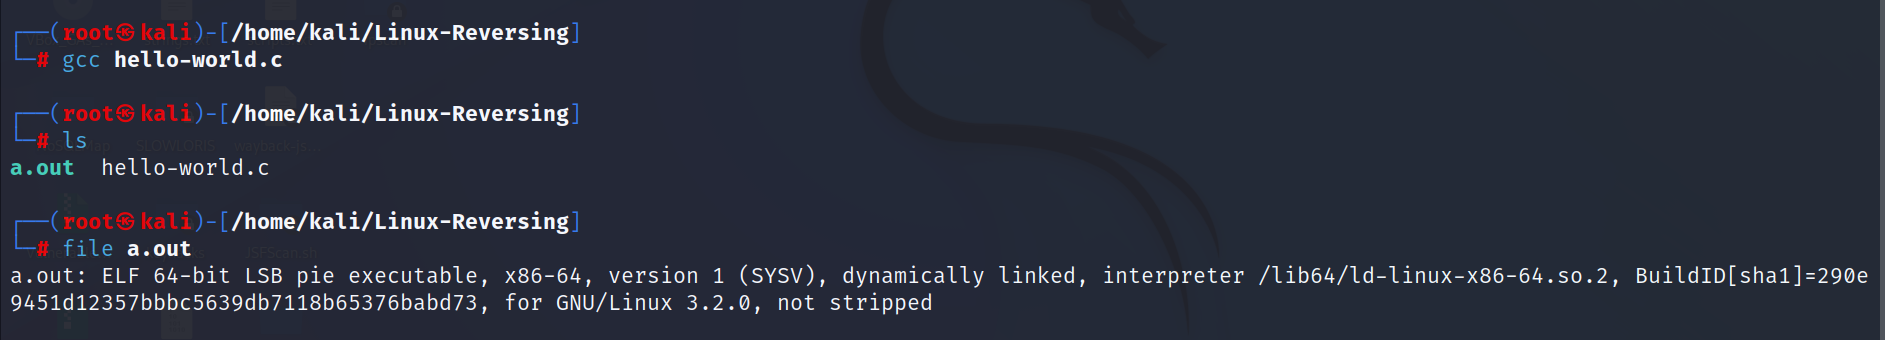
ELF (Executable and Linkable Format) is a common file format for executables, object code, shared libraries, and core dumps on Linux and other Unix-like systems. ELF files can be either 32-bit or 64-bit, depending on the architecture of the system they are intended to run on.
As we have confirmed that the binary is executable, we can execute it as follow. ./Filename
We just built our first executable file. Let's see how we can reverse it. But before that, quickly rename the package by using mv a.out hello it for better handling. Otherwise, we can also give a name by ourselves when building the executable. using gcc hello-world.c -o hello
We can start reversing by looking into the strings of the binary. let's see how to do that.
strings hello
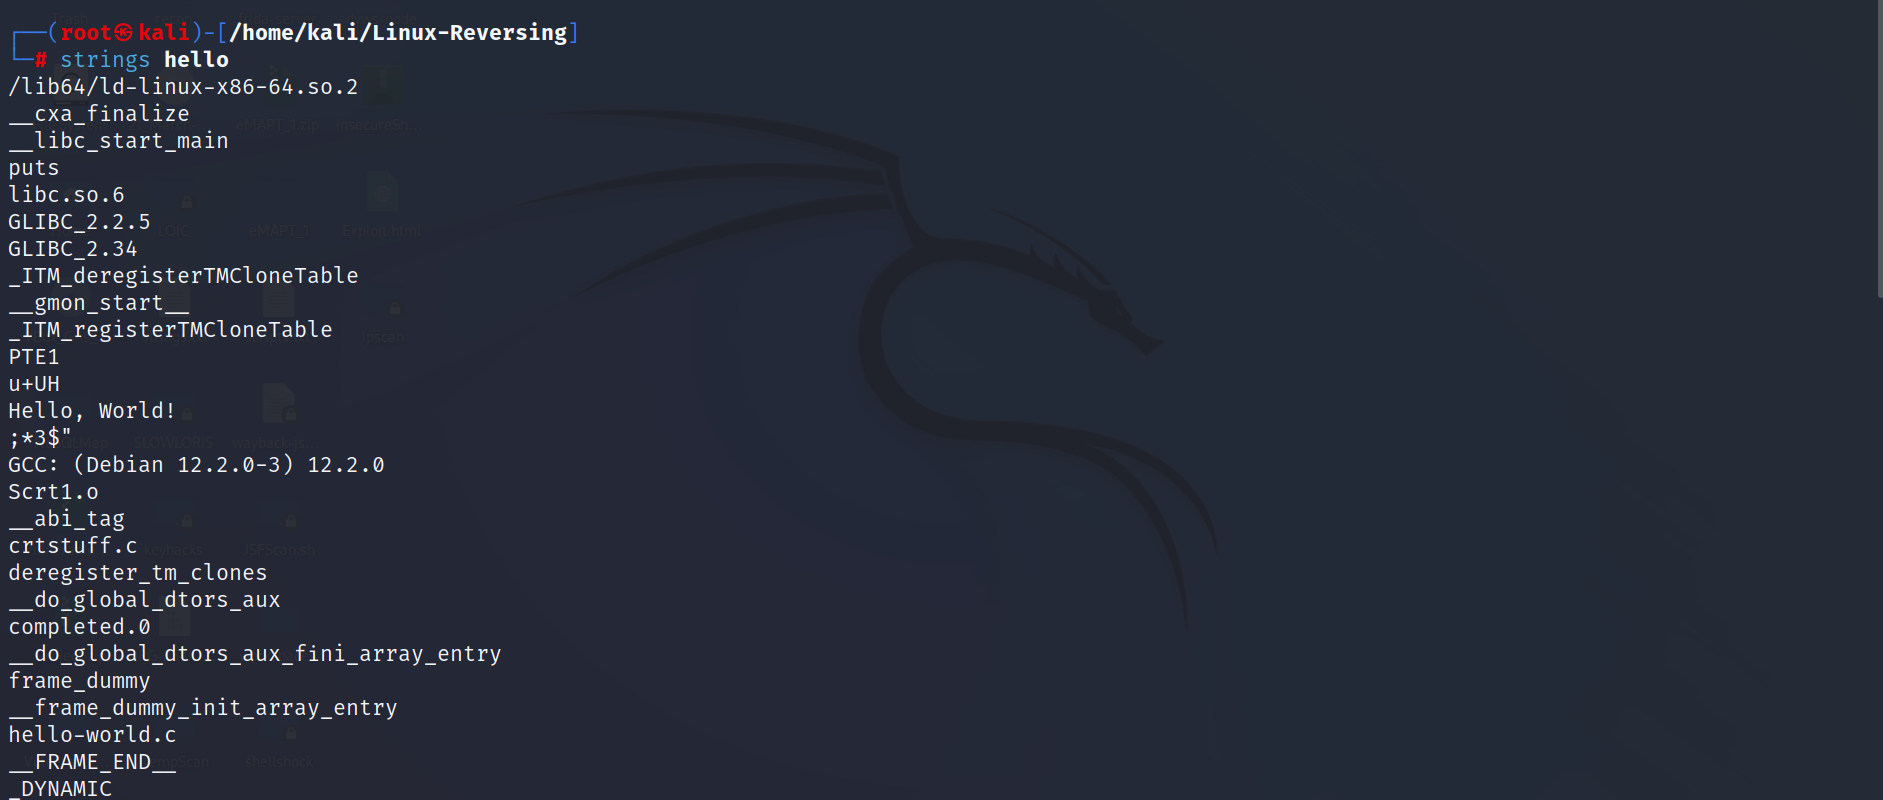
As you can see, we can successfully retrieve the hello world string from our binary. Now while analyzing any real-world application, this can be anything secrets, passwords, tokens etc.
Not only this, there is a lot of other information we can extract from, and it will help us to know binary better.
/lib64/ld-linux-x86-64.so.2: This is the path to the dynamic linker on a 64-bit Linux system. The dynamic linker is a program that is responsible for loading and linking shared libraries at runtime.__cxa_finalize: This is a function in the C++ standard library that is called to perform cleanup tasks when a program terminates. It is usually used to deallocate memory and release resources acquired during the program's lifetime.__libc_start_main: This is a function in the C standard library responsible for starting a C program's main function. It is called by the dynamic linker when a program is executed.puts: This function in the C standard library is used to output a string to the standard output stream (usually the console).libc.so.6: This is the name of the C standard library on a Linux system. It is a shared library that provides a variety of functions that are used by most programs.GLIBC_2.2.5: This is a version number for the GNU C library, which is the implementation of the C standard library used on most Linux systems.GLIBC_2.34: This is another version number for the GNU C library.GCC: (Debian 12.2.0-3) 12.2.0: This is information about the compiler that was used to build the program. It indicates that the program was compiled with the GCC compiler on a Debian system, and the version of the compiler is 12.2.0.
Disassembling is the process of translating machine code (the instructions that a computer can execute directly) into a human-readable representation of those instructions. This representation is called assembly code, and it is typically written in a programming language called assembly language.
Disassembling is often used to reverse engineer a program or to understand how it works. It can also be used to modify the behaviour of a program by modifying the assembly code and then reassembling it.
Now disassemble the code by using objdump the command. As you can see follow, we have disassembled the code. Check what's in the disassembled code.
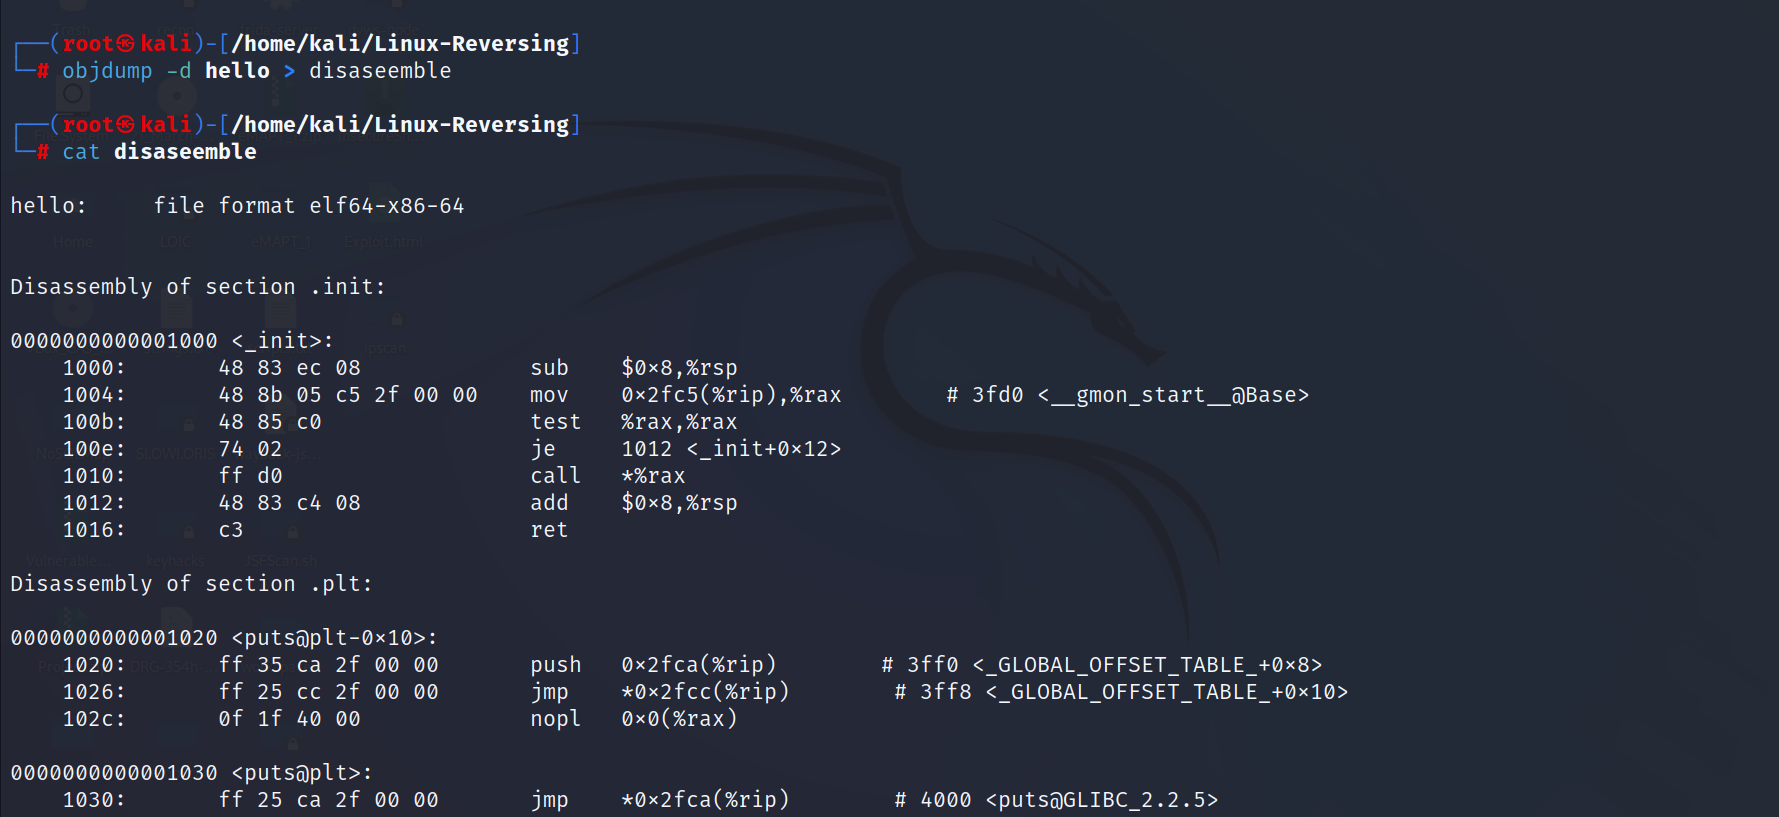
It shows the working of each execution function, what the function is doing and how it's doing.
Dynamic Analysis
Dynamic analysis is a technique that involves executing a program and observing its behaviour while it is running. It is often used to identify and debug problems in a program or to understand how the program works and what it does.
Various tools and techniques can be used to perform dynamic analysis of a Linux application.
Some Common dynamic analysis approaches
- Debugging: Debuggers are tools that allow you to execute a program line by line and inspect the values of variables and registers at each step. This can help you understand how a program is working and identify problems. Some popular debuggers for Linux include GDB, LLDB, and Valgrind.
- Tracing: Tracing tools allow you to record the execution of a program and analyze the resulting trace to understand how the program is working. Tracing can be used to identify performance bottlenecks, understand how a program interacts with the operating system and other programs, and more. Some popular tracing tools for Linux include strace, ltrace, and perf.
- Monitoring: Monitoring tools allow you to observe the behaviour of a program in real-time and capture metrics such as CPU and memory usage, network activity, and more. This can help you identify problems and optimize the performance of a program. Some popular monitoring tools for Linux include top, htop, and sar.
First, we look for tracing:
Few examples with various tools
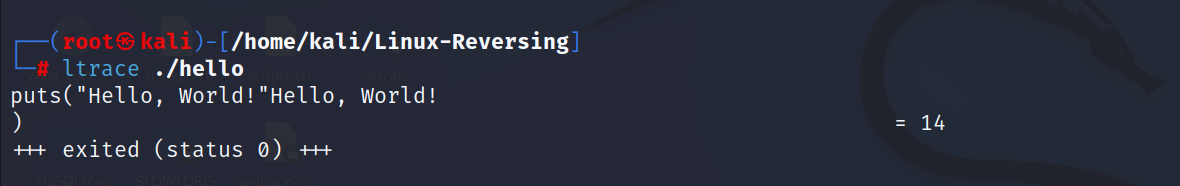
- ltrace ./hello
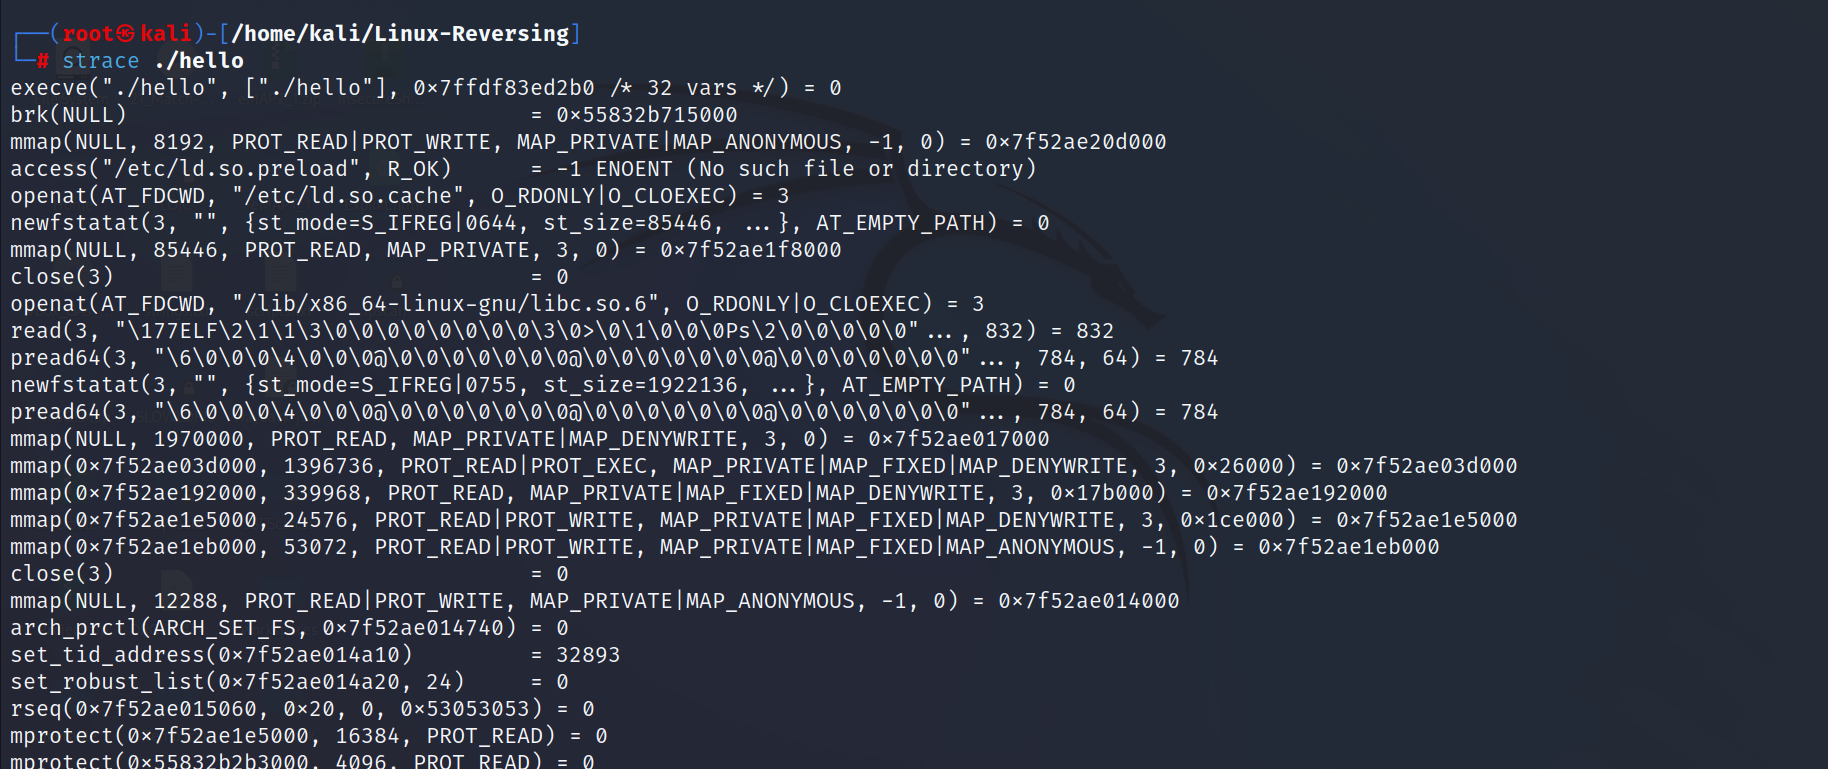
2. strace ./hello
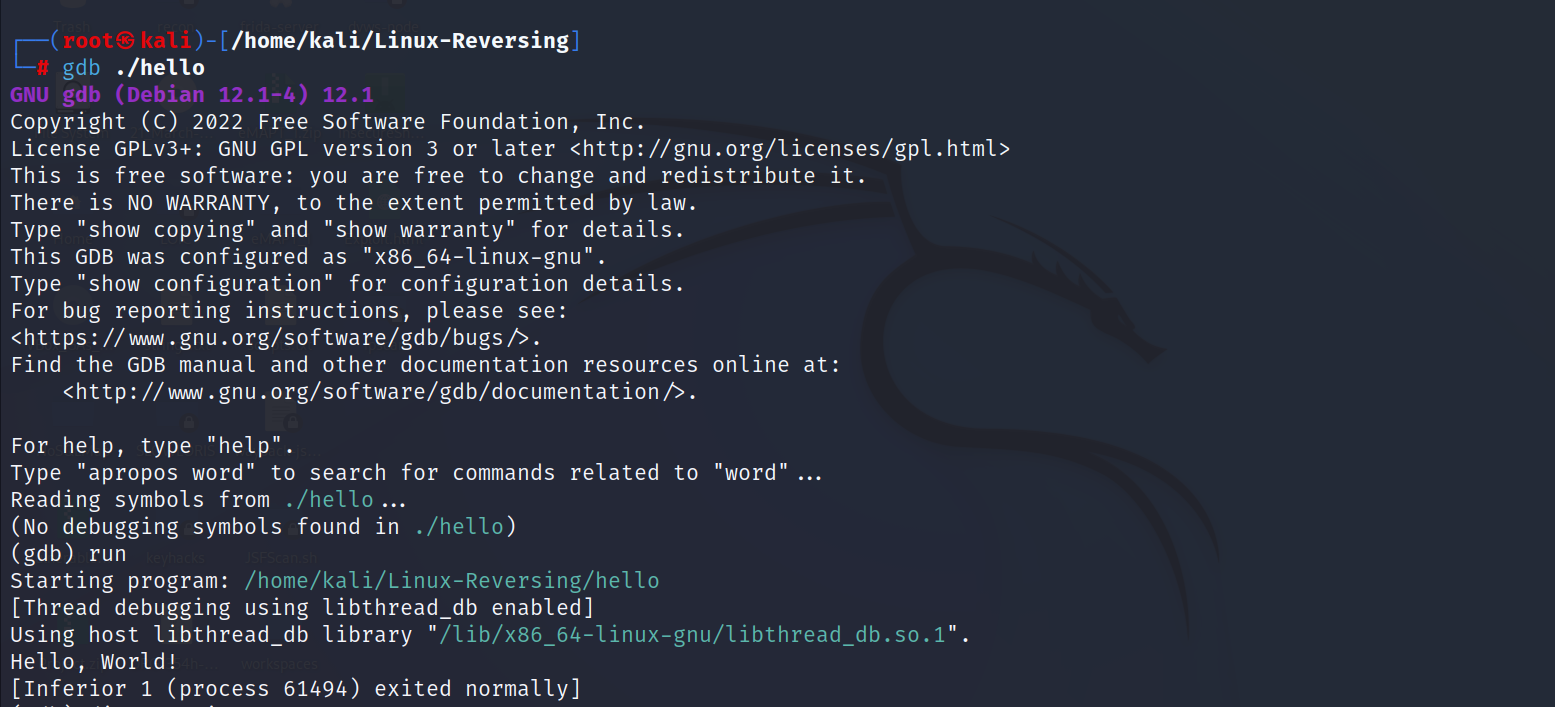
3. gdb ./hello
GDB (GNU Debugger) is a free, open-source debugger that can be used to troubleshoot and debug programs written in C, C++, and other languages. GDB allows you to execute a program in a controlled environment, pause its execution at any point, and examine the state of the program at that point in time.
To use GDB, you will first need to compile your program with debugging symbols enabled. This will allow GDB to map the execution of your program to the source code and provide you with more detailed information about the state of the program.
To start GDB, you can type "gdb" followed by the name of the executable file that you want to debug. Once GDB is running, you can use a variety of commands to control the execution of the program and examine its state.
Common GDB Commands
break: Set a breakpoint at a specific line of code or function.run: Start execution of the program.step: Execute the next line of code and pause.next: Execute the next line of code, but skip over function calls.continue: Continue execution of the program until the next breakpoint is reached.print: Print the value of a variable or expression.
GDB also has a number of other features, such as support for debugging multiple threads and processes, the ability to examine memory contents, and the ability to attach to and debug running processes
We can also disassemble the function we want, as shown in the following example.

We can set breakpoints and then analyze the file, such as setting breakpoints and then execute them one by one to analyze. please check the following example where we have set three breakpoints and then run to move on next breakpoint we can use next command

This is a short brief about tracing the binary and dynamic analysis of the application.
Monitoring
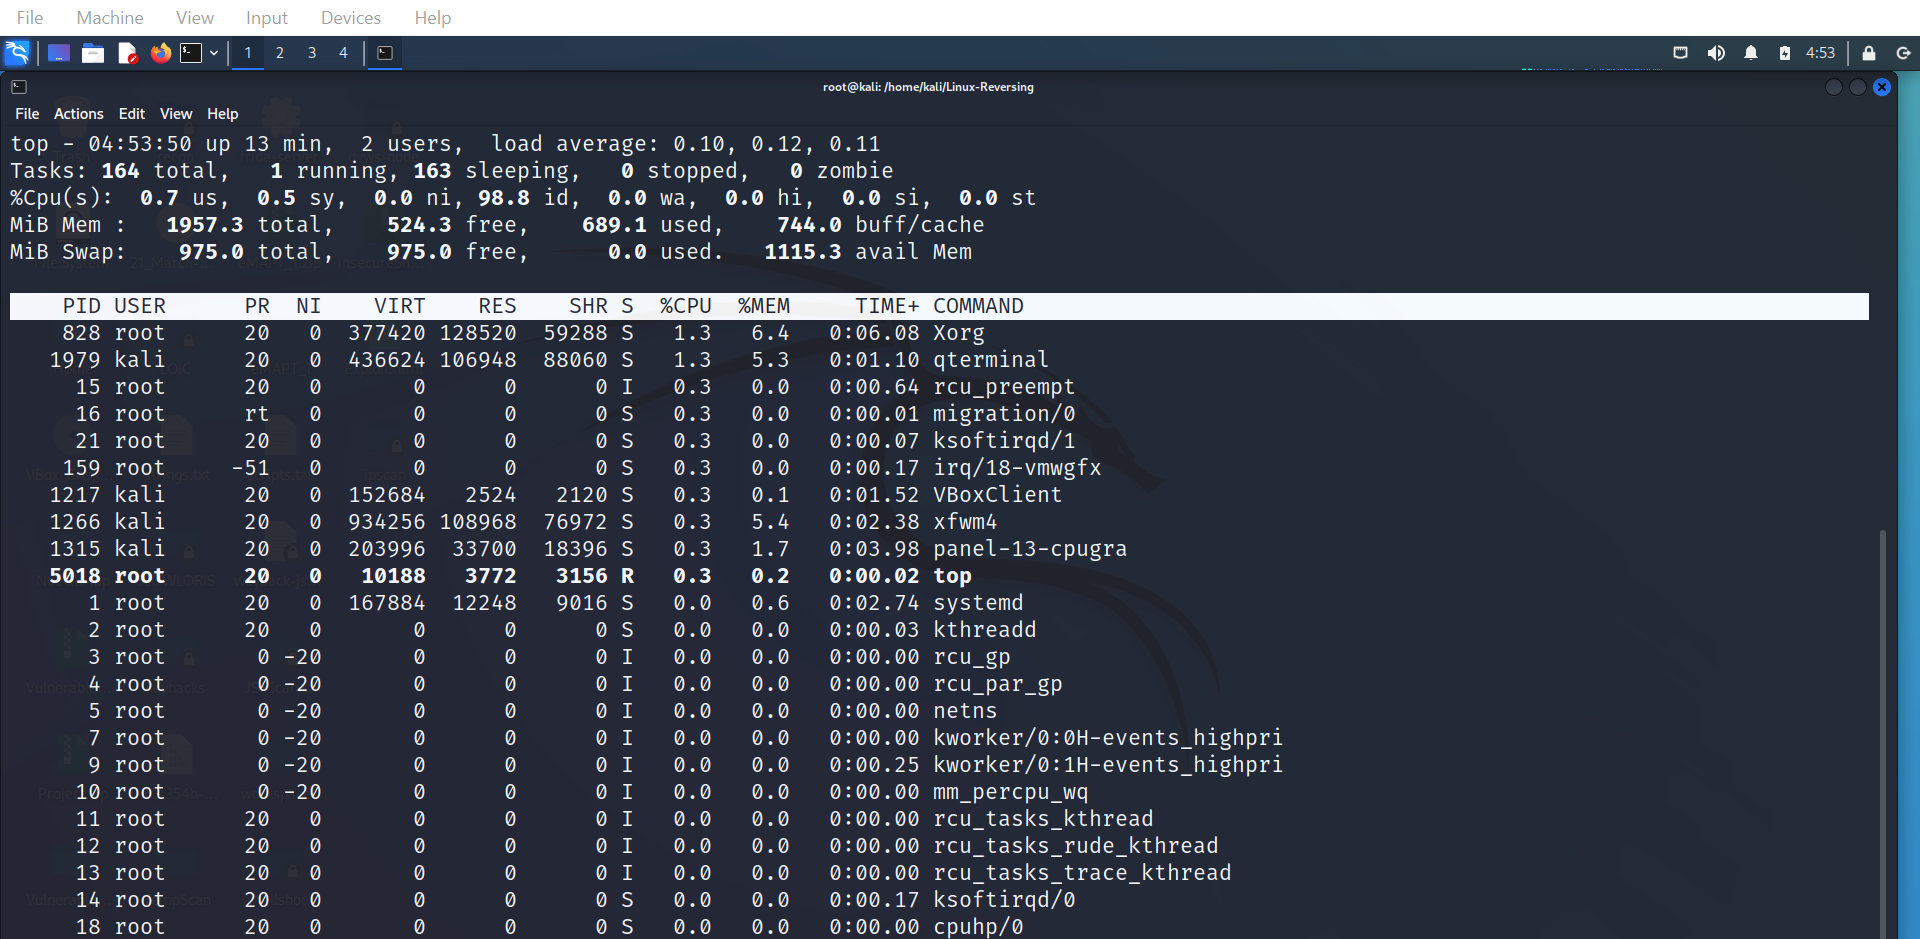
Top is a command-line utility that displays information about the running processes on a system, including their CPU and memory usage. Htop is a similar tool that has a graphical interface and additional features such as the ability to kill processes. Sar is a system performance monitoring tool that allows you to collect and view data on various system resources over time.
top command:

htop command:


These tools can be useful for understanding how a program is using system resources and for identifying performance issues. They can also be used in combination with other tools and techniques, such as debugging and tracing, to get a more complete picture of a program's behavior.